Not all voxels are created equal: reducing estimation bias in regional NODDI metrics using tissue-weighted means
This post describes the tissue-weighted mean, a technique to address a hitherto unrecognised problem in estimating mean tissue microstructure within a region of interest. In brief, the technique provides a more accurate estimate of ROI means in the presence of CSF partial volume.
Table of contents
- What is the problem?
- What is the tissue-weighted mean?
- Evidence of bias in real-world data
- Summary
- References
What is the problem?
CSF partial volume can be a significant problem for estimating microstructure. Techniques that model CSF explicitly have been proposed to eliminate the effect of CSF contamination (Pasternak et. al. 2009, Mag. Res. Med., Zhang et. al. 2012, Neuroimage). Addressing this problem is especially important for studies of aging and neurodegenerative diseases (Metzler-Baddeley et. al., 2012, Neuroimage).
However, this approach renders the conventional way of computing ROI means problematic. Figure 1 illustrates this with a toy example using NODDI.
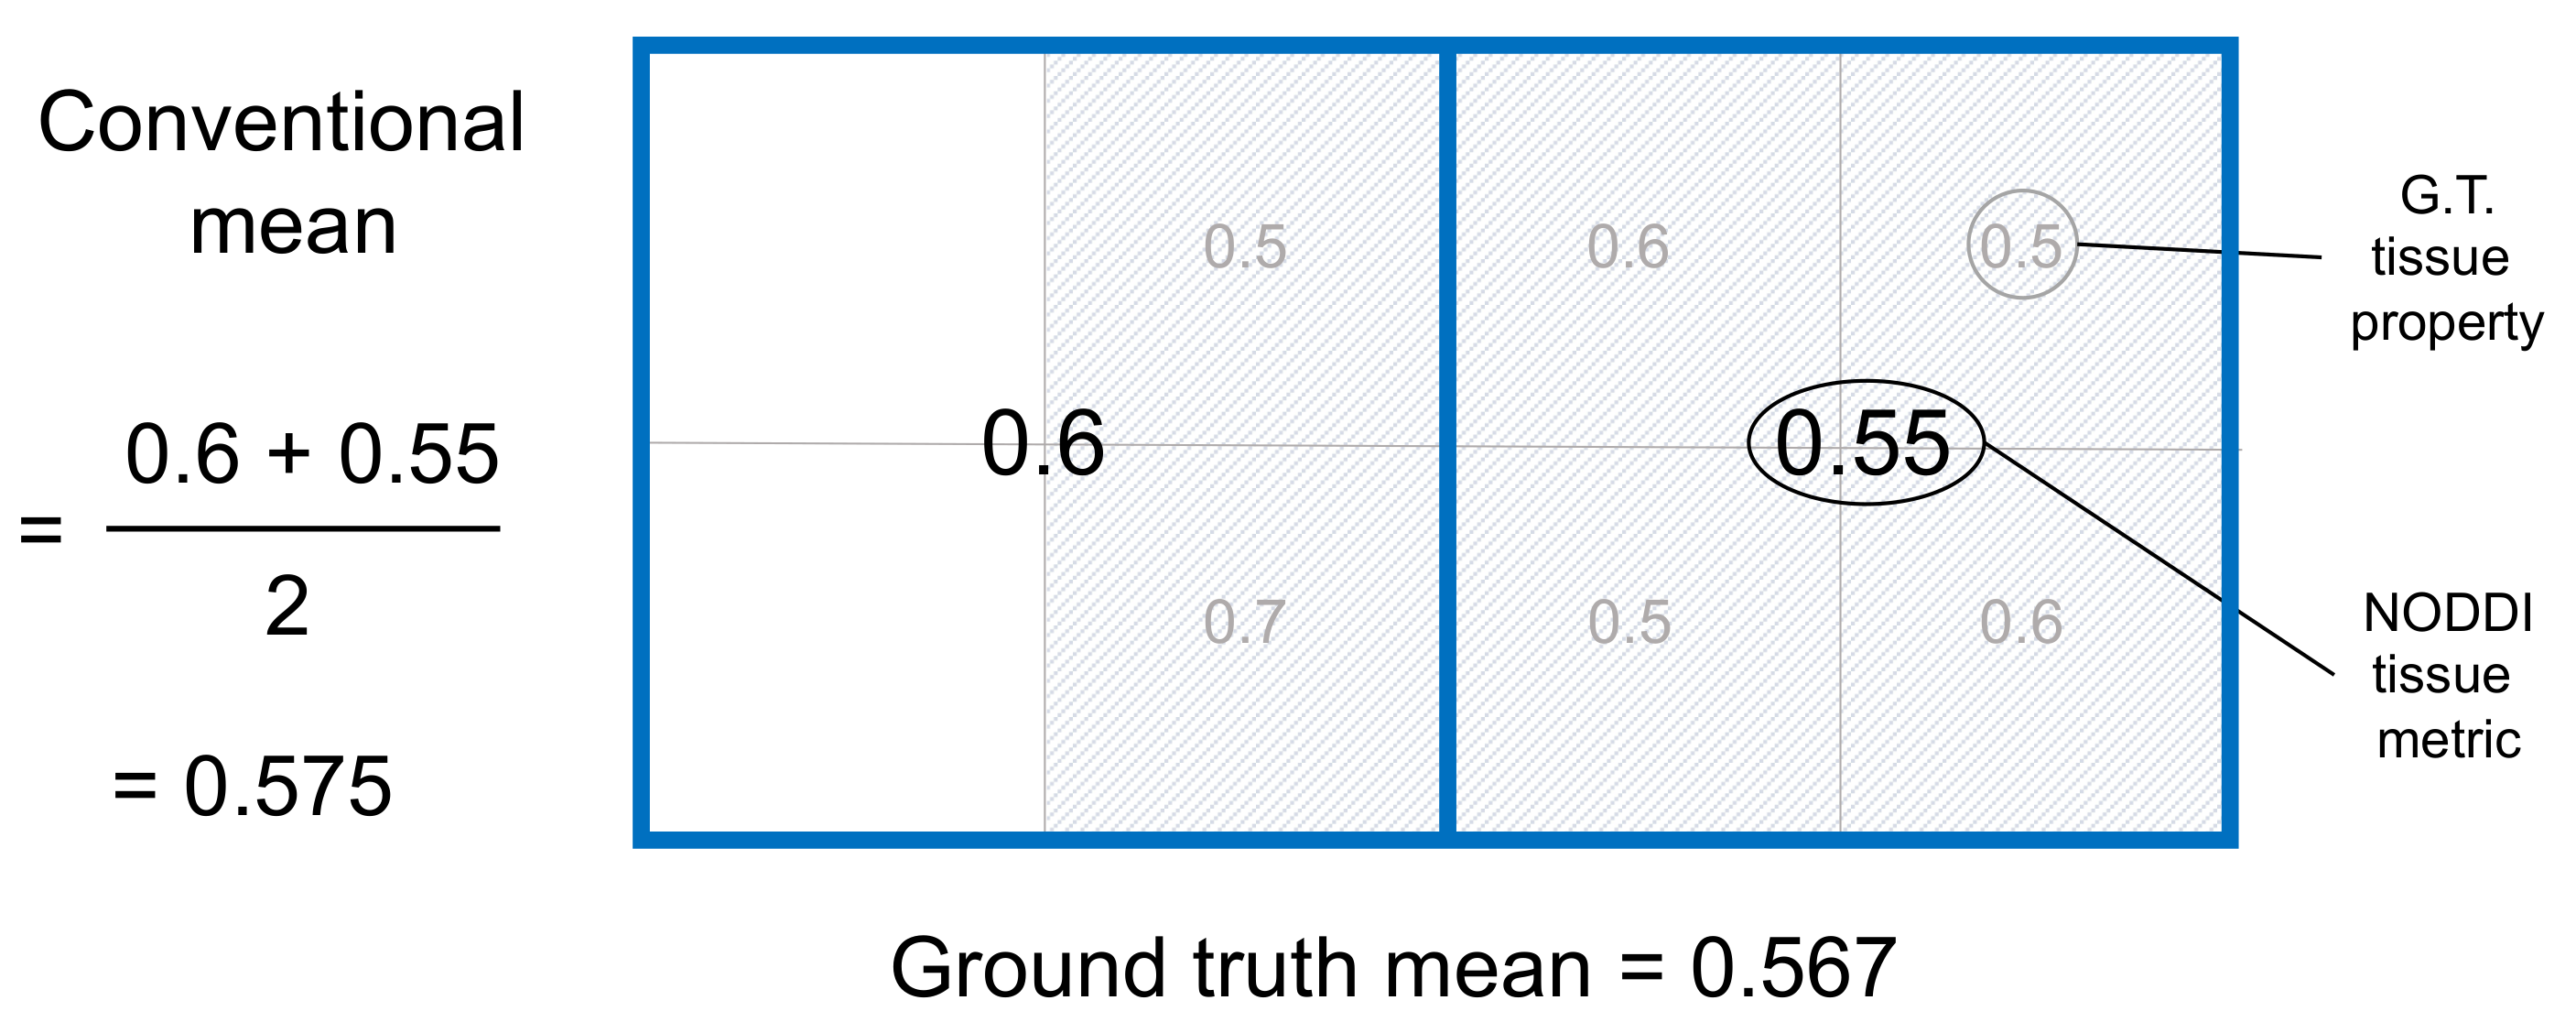
The figure depicts an ROI consisting of two voxels that cover an area of brain tissue and CSF. The ground truth ROI mean is 0.567, which is the average of the ground truth tissue properties in each sub-square of the tissue within the ROI.
The conventional mean simply averages the estimated tissue metric from the two voxels that make up the ROI. It estimates the ROI mean as 0.575, which is incorrect. The figure explains why this is wrong: the conventional mean ignores the fact that the amount of tissue in the voxels comprising the ROI are different. The voxel on the left is half tissue, half CSF. In contrast, the voxel on the right contains only tissue. By ignoring variation in tissue volume across voxels, the conventional mean has over-weighted the contribution of voxels containing less tissue.
The conventional mean can therefore produce inaccurate results for ROIs which contain voxels contaminated by CSF. This is a problem not only when estimating the ROI mean of NODDI tissue metrics, but the ROI mean of any tissue metric derived from a model that also estimates the amount of tissue in each voxel, such as the free water elimiation (FWE) method (Pasternak et. al. 2009, Mag. Res. Med.).
What is the tissue-weighted mean?
The problem of mis-estimating ROI means in the presence of CSF partial volume is overcome by applying the tissue-weighted mean. This weighted mean sums the tissue metric across the tissue within the ROI and divides by the total tissue volume:
The correct weighting is prescribed for each voxel by using the tissue volume fraction estimates as weights. This calculation is made possible when tissue metrics are accompanied by estimates of tissue volume, as is the case with NODDI and the FWE method.
The example below demonstrates that the tissue-weighted mean produces accurate estimates of ROI means in the presence of CSF contamination.
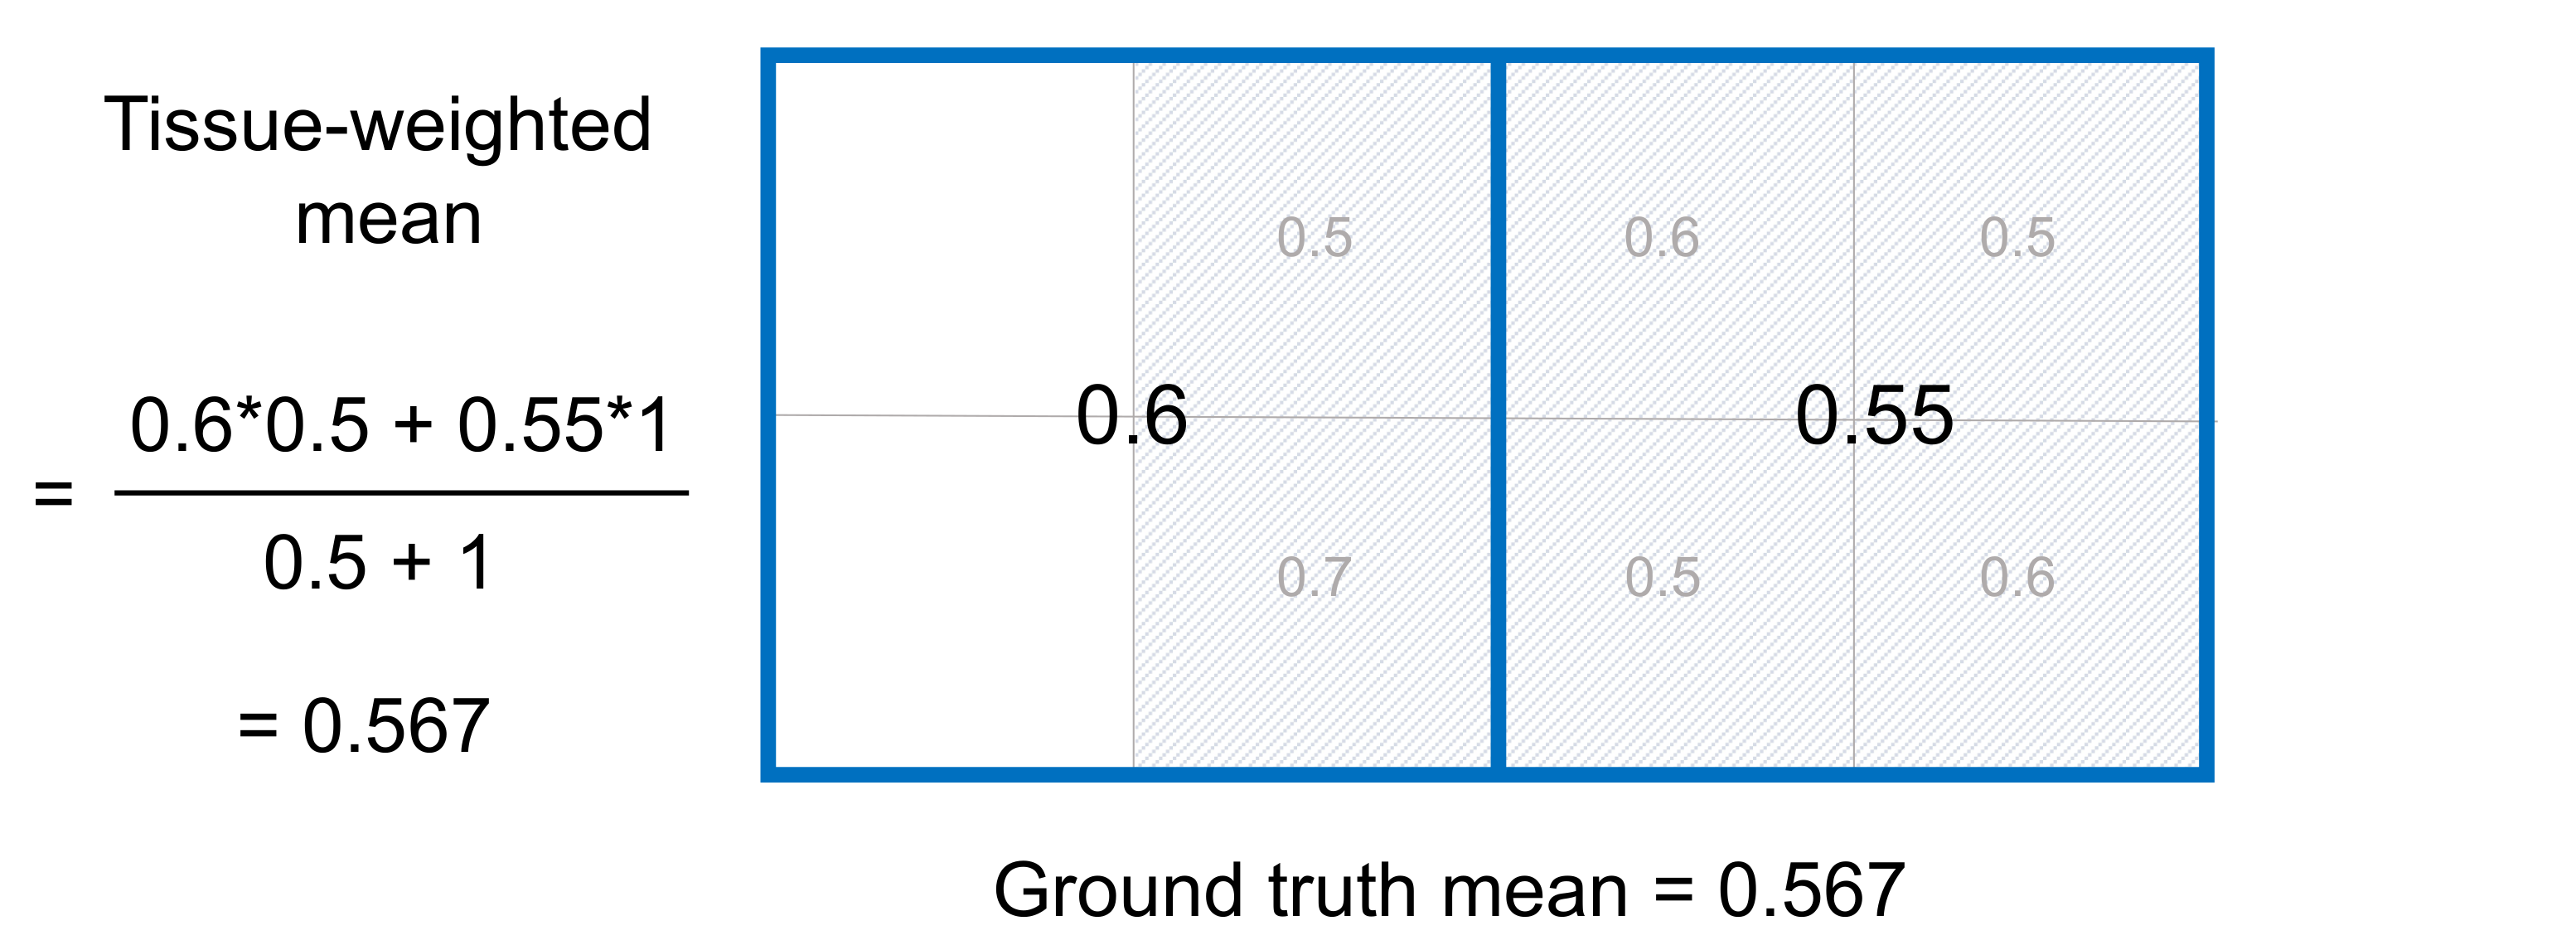
In comparison to the conventional mean, the tissue-weighted mean has correctly estimated the ground truth ROI mean. Using the tissue-weighted mean may be important for studies of ROIs that border CSF and in cases of neurodegenerative disease where atrophy can lead to larger ventricle volumes and more CSF contamination.
Evidence of bias in real-world data
Below is a summary of our study comparing the tissue-weighted and conventional means in a cohort of control subjects and patients with neurodegenerative disease. The tissue-weighted mean is used to measure the extent of bias in conventional means and its impact on group differences.
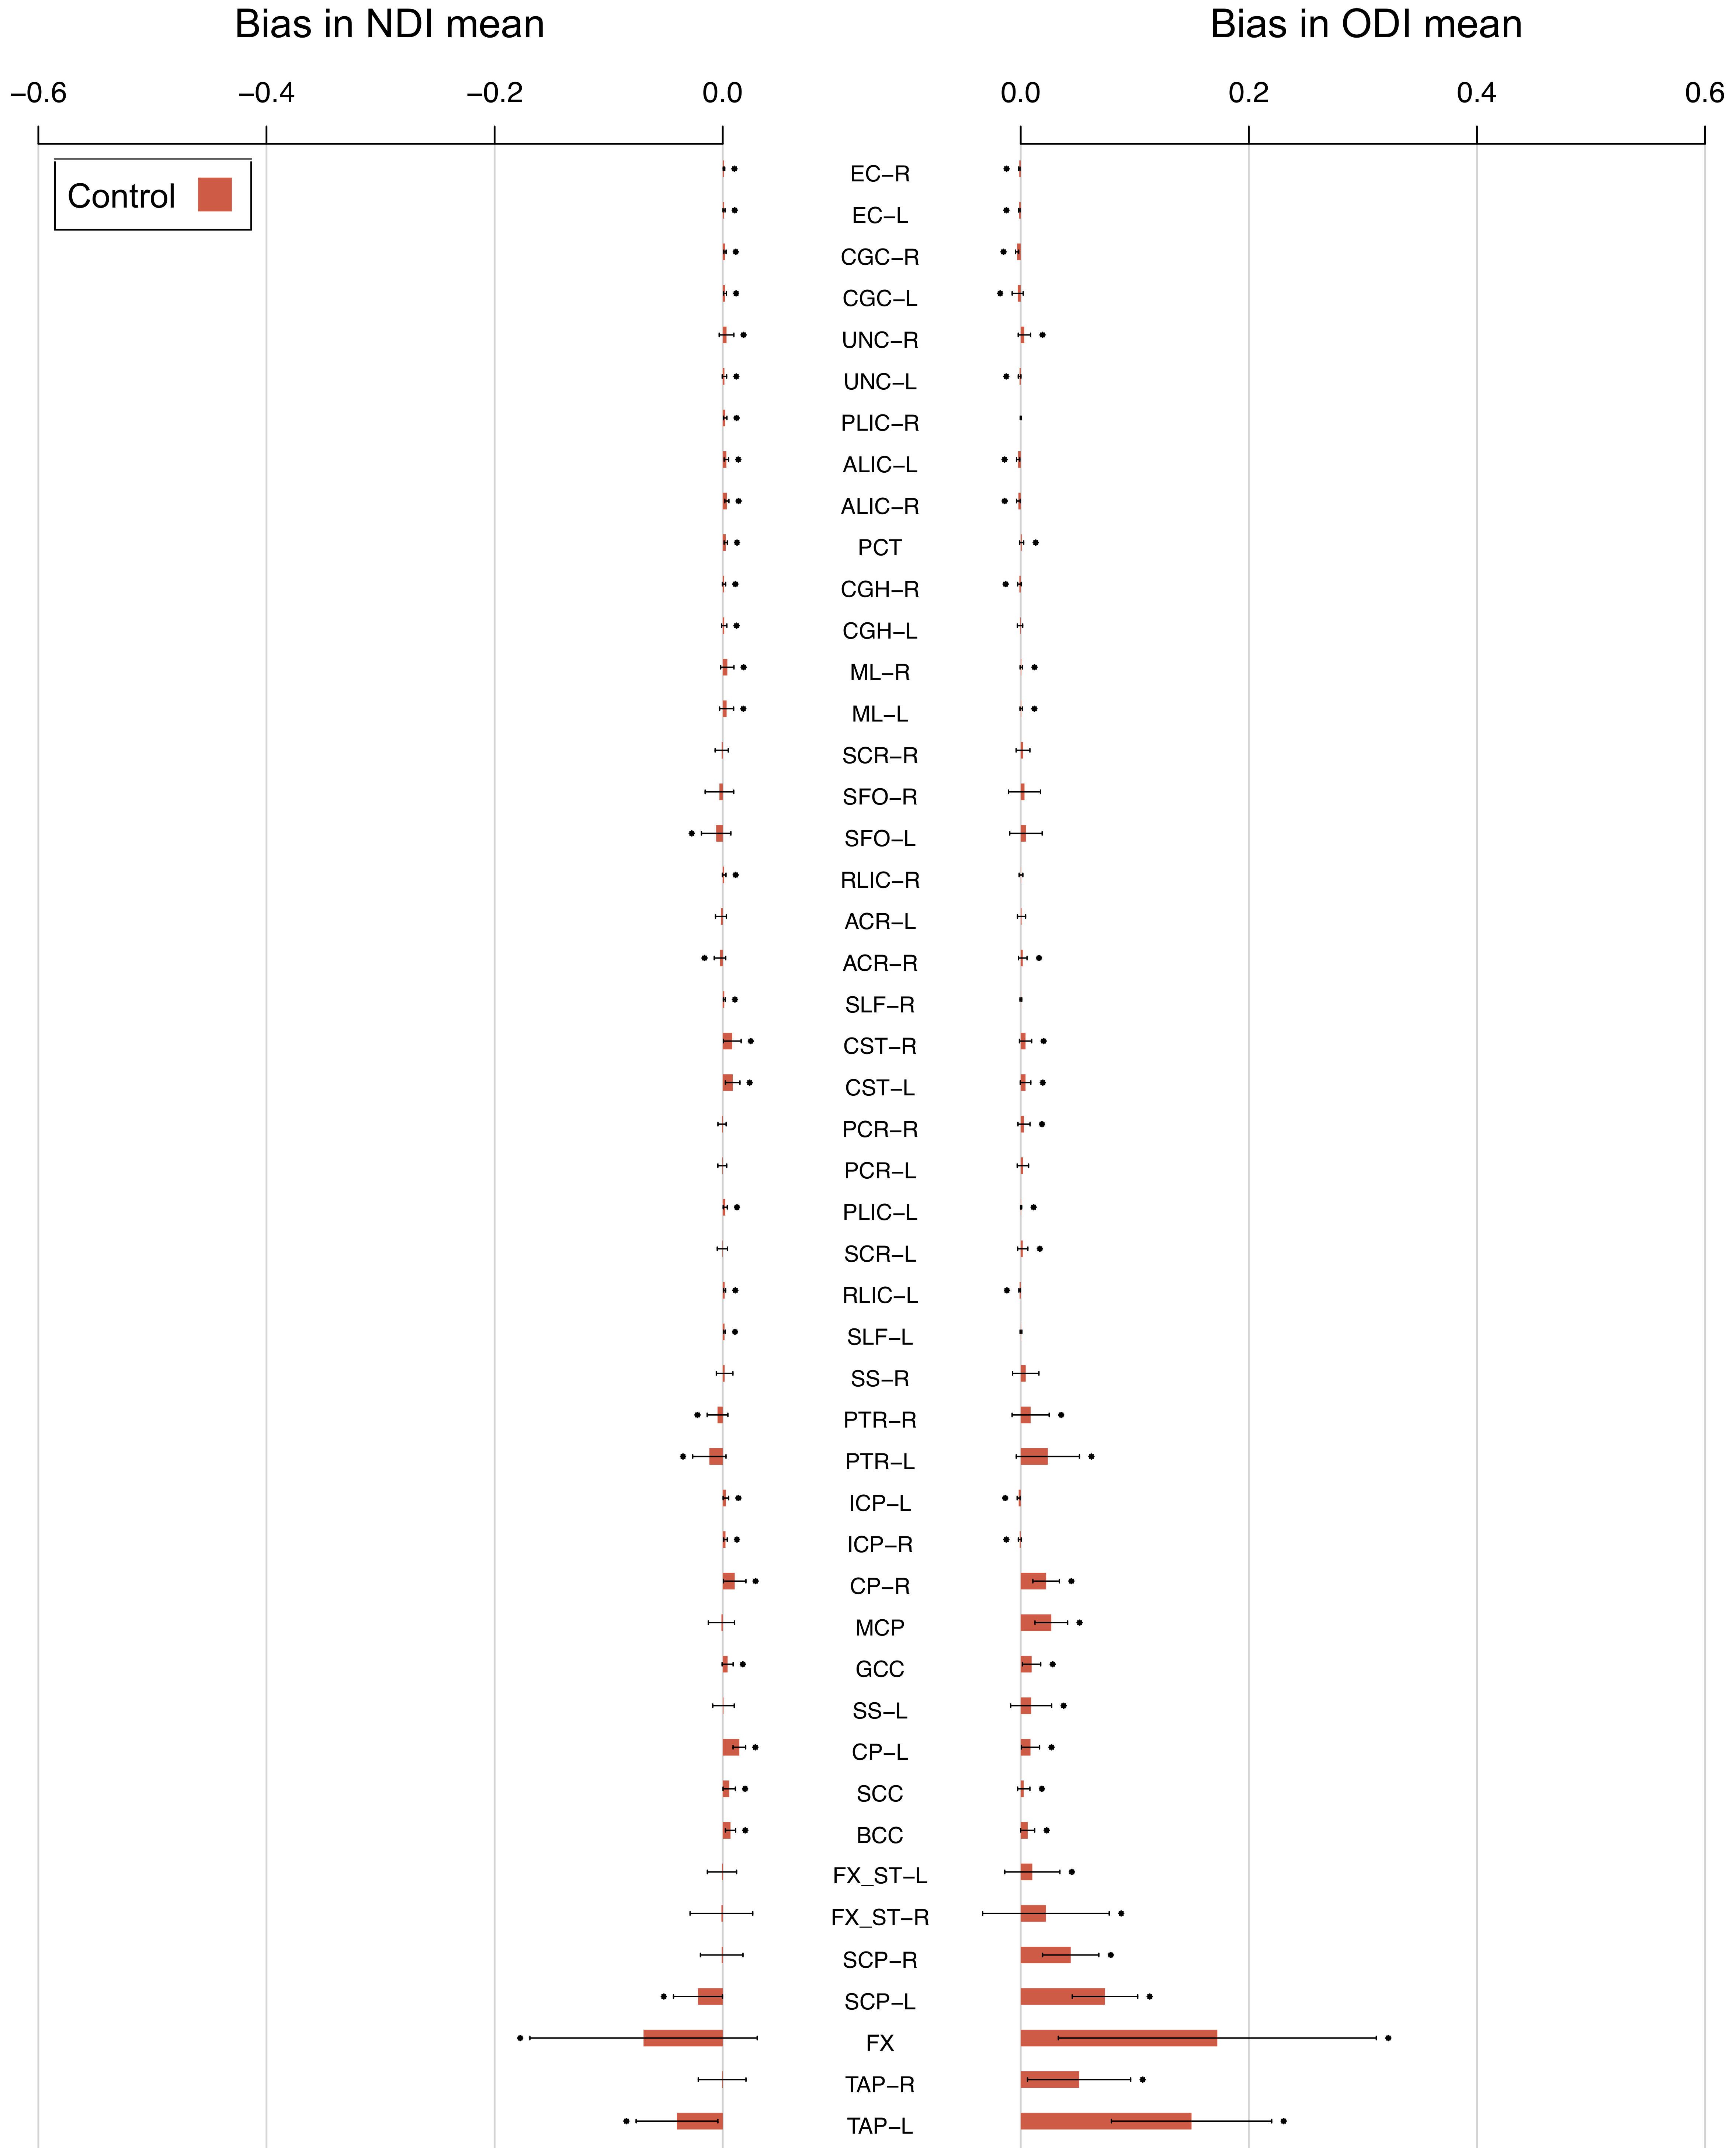
Bias is higher in patients and in ROIs that border CSF.
The magnitude of bias in conventional ROI means is significantly higher than zero for many ROIs, for both healthy control subjects and patients with young onset Alzheimer’s disease (YOAD). This is demonstrated by the high number of ROIs with points above the bar in the plot below, denoting that the mean of the bias (the height of the bar) across subjects is not equal to zero.
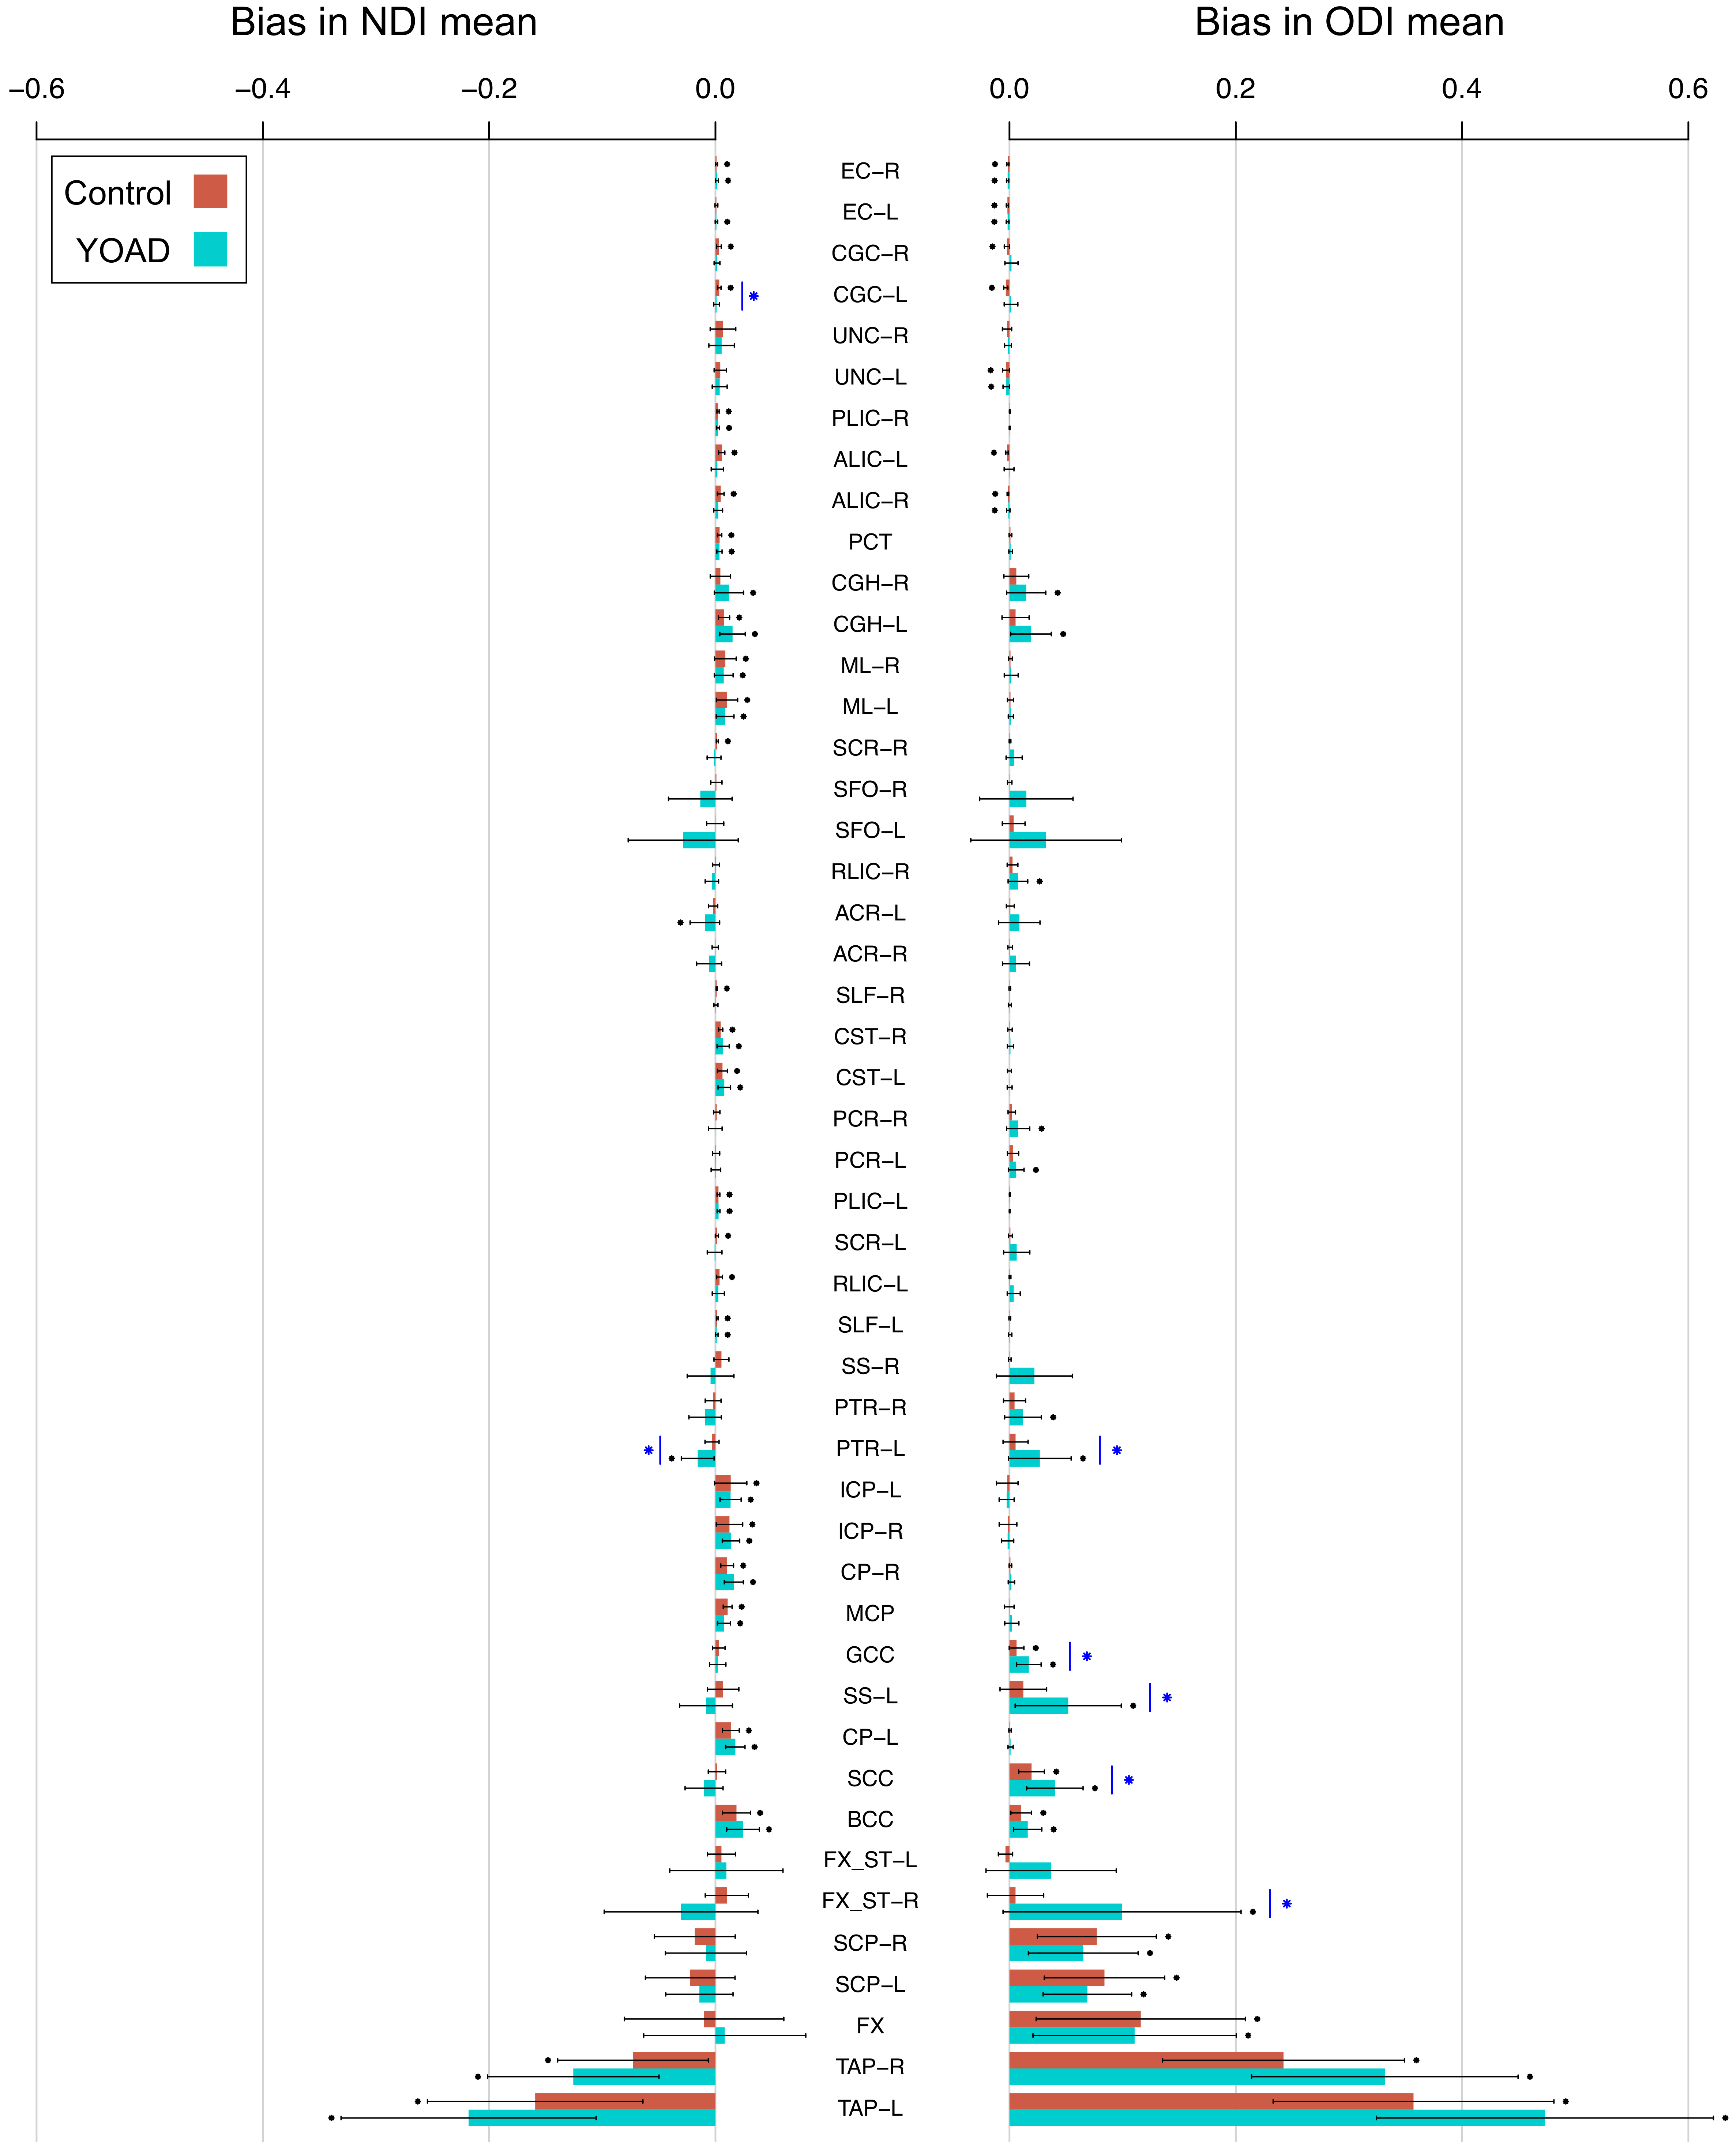
The figure shows that bias is more extreme in the ROIs that border CSF (such as the fornix (FX)) compared to those that do not (such as the superior longitudinal fasciculus (SLF)). Furthermore, subjects with YOAD (turquoise bars) tend to have more extreme bias than control subjects (red bars). This is because YOAD patients have larger ventricle volumes due to brain atrophy.
Conventional means mis-estimate group differences.
Because the patient group tends to have higher bias than the control group, the tissue-weighted mean tends to correct the ROI mean of the patient group more so than the control group. This results in a mis-estimation of group differences when using the conventional mean.
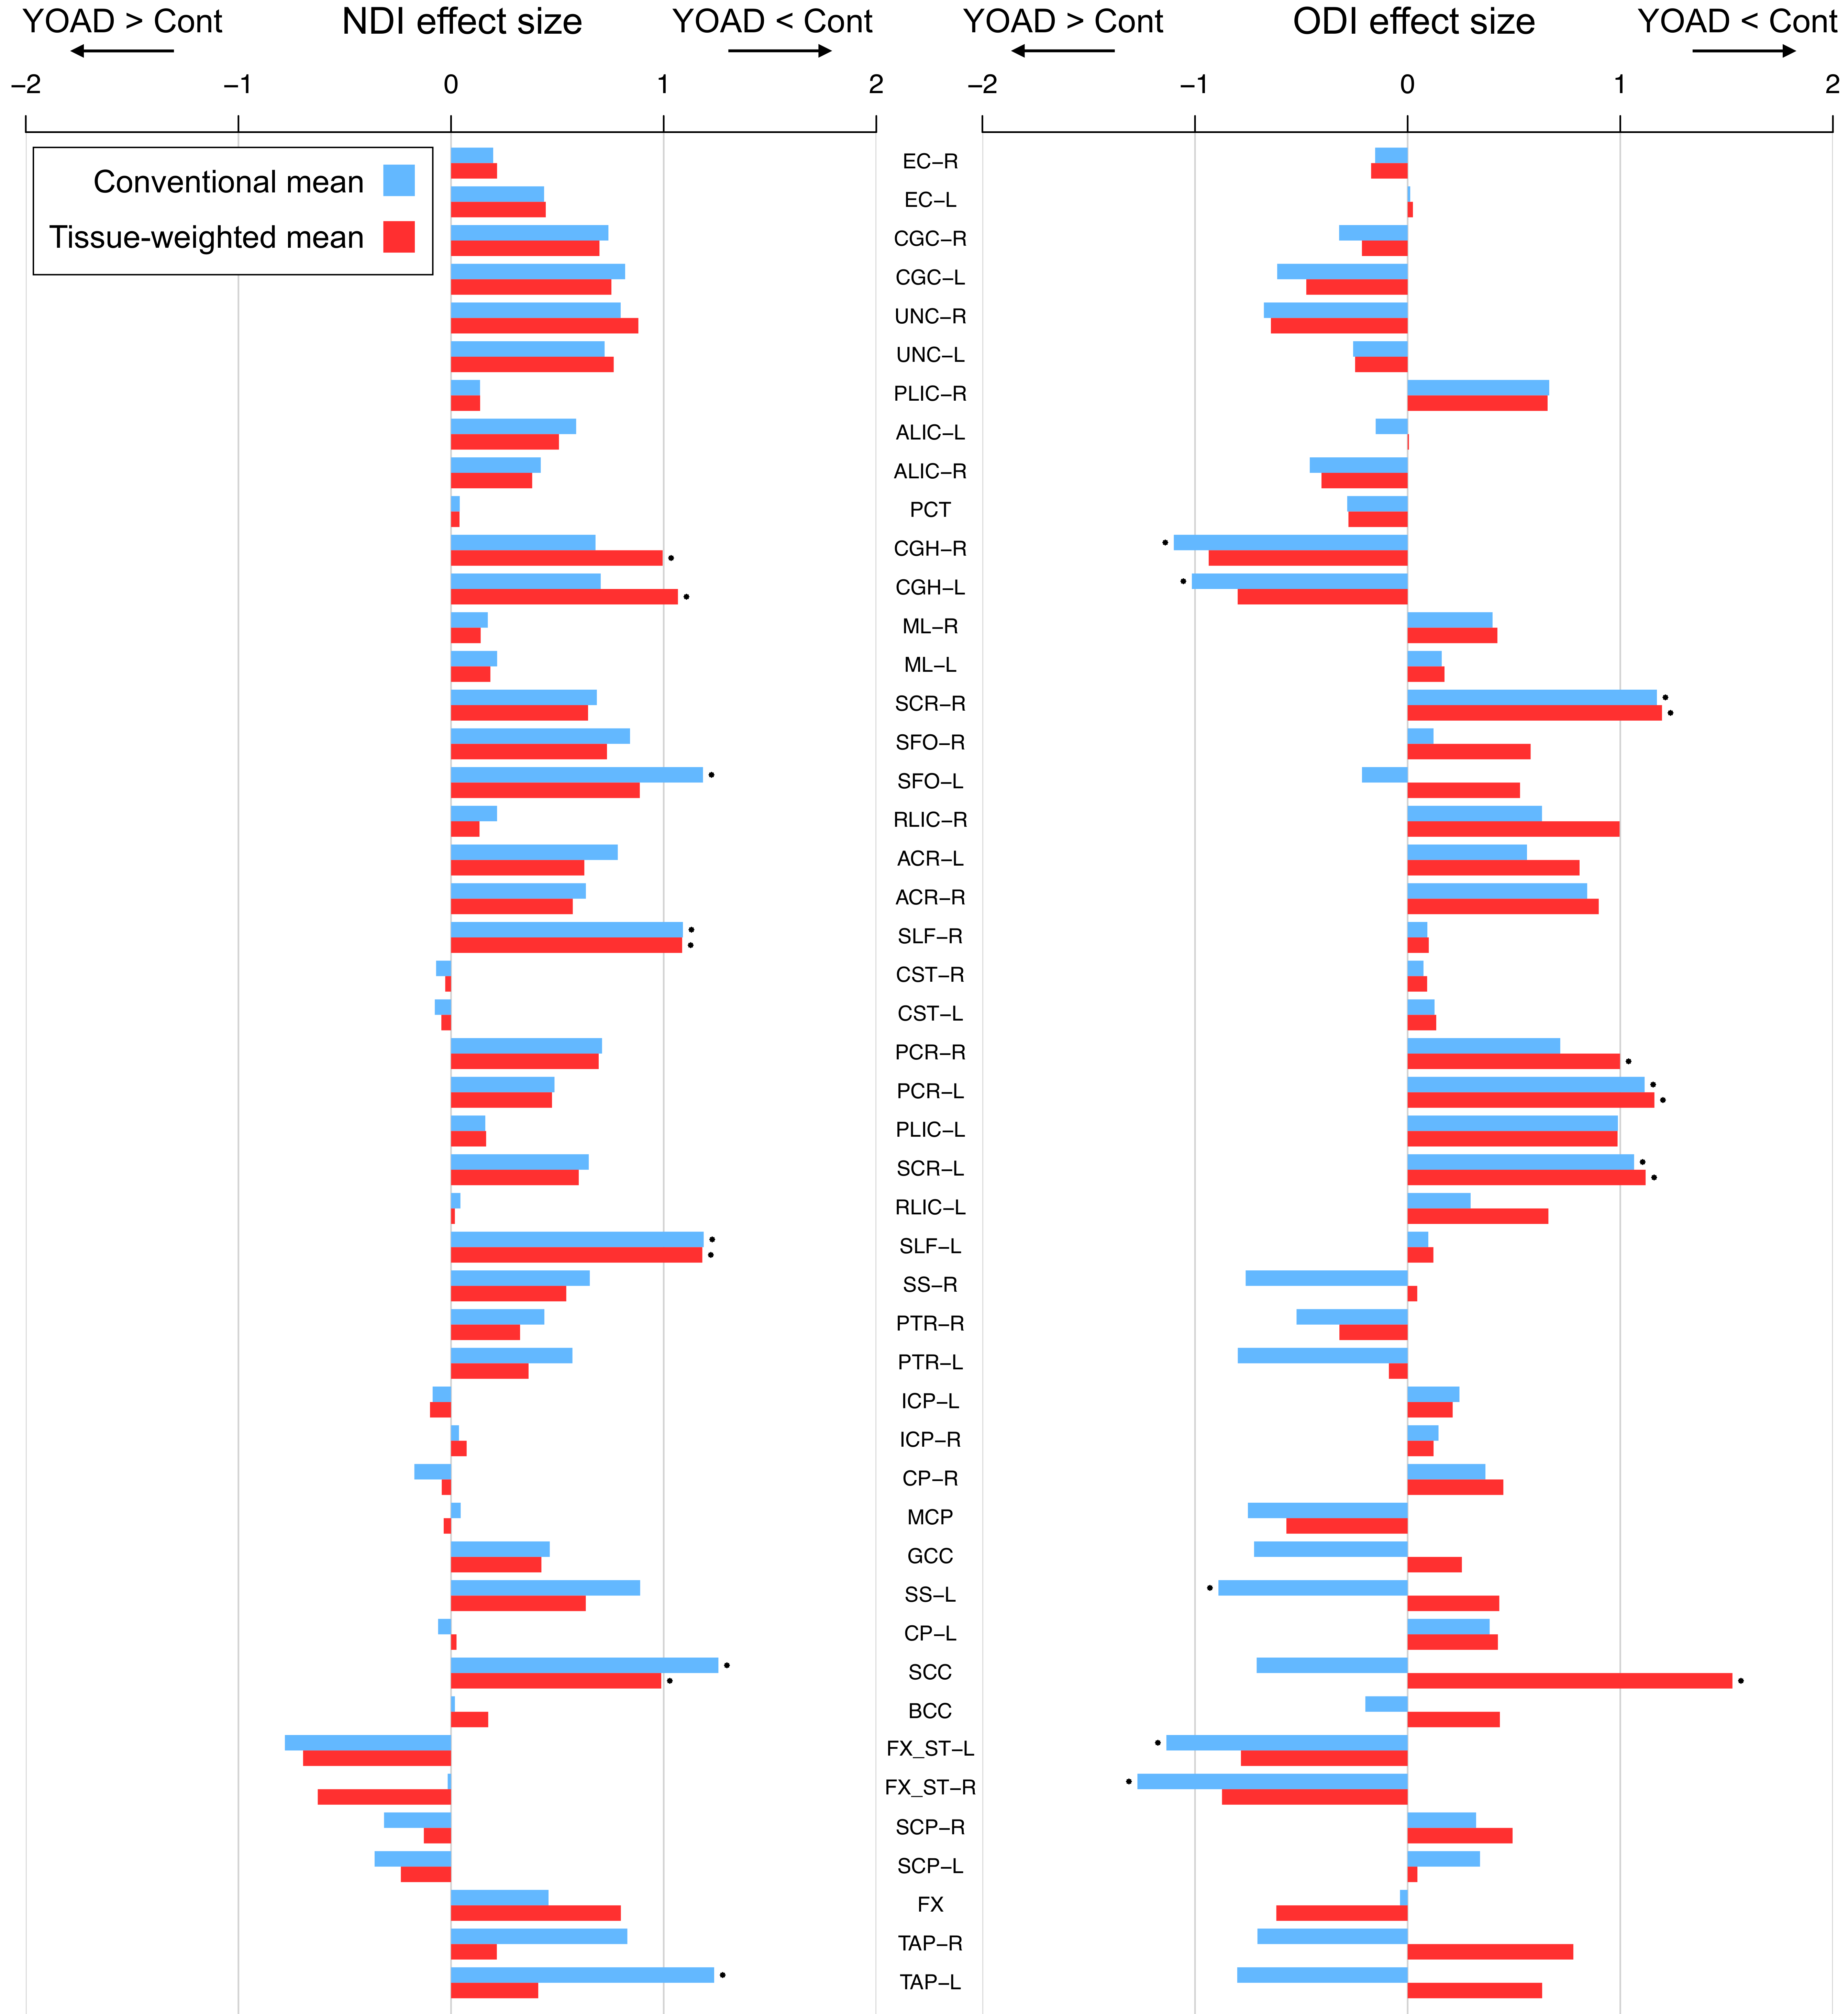
This mis-estimation of group differences particularly affects those ROIs that typically border CSF (e.g. FX) or become more contaminated by CSF following brain atrophy (e.g. the hippocampal cingulum (CGH)).
Bias remains at higher image resolution.
Despite ROIs in higher resolution images containing relatively fewer voxels that border CSF, significant levels of bias are still observed for many ROIs. This is shown in data from the Alzheimer’s Disease Neuroimaging Initiative, where voxels occupy half the volume as for the YOAD dataset.
As before, bias is higher for ROIs that border CSF. As suggested by the YOAD study, such bias is likely to result in mis-estimation of group differences, due to the greater correction of CSF contamination in the patient group.
Summary
Advanced diffusion MRI models can estimate tissue-specific parameters by explicitly accounting for CSF contamination. However, conventional ROI means of such tissue metrics are nevertheless biased when the ROI contains voxels contaminated with CSF (Fig 1, 3). The tissue-weighted mean leverages tissue volume fraction estimates to overcome this (Fig. 2). This allows more accurate estimates of ROI means in the regions bordering CSF and in studies of aging and neurodegenerative disease (Fig. 4).
To read more about the tissue-weighted mean and learn how to apply it to your dataset, check out the official publication and dedicated walkthrough.
References
Parker, C.S., Veale, T., Bocchetta, M., Slattery, C.F., Malone, I.B., Thomas, D.L., Schott, J.M., Cash, D.M. & Zhang, H., 2021. Not all voxels are created equal: reducing estimation bias in regional NODDI metrics using tissue-weighted means. Neuroimage, 118749. doi: https://doi.org/10.1016/j.neuroimage.2021.118749
Pasternak, O., Sochen, N., Gur, Y., Intrator, N. and Assaf, Y. Free water elimination and mapping from diffusion MRI. Magnetic Resonance in Medicine: An Official Journal of the International Society for Magnetic Resonance in Medicine 62(3), 717-730 (2009). https://doi.org/10.1002/mrm.22055
Zhang, H., Schneider, T., Wheeler-Kingshott, C. A. & Alexander, D. C. NODDI: practical in vivo neurite orientation dispersion and density imaging of the human brain. Neuroimage 61, 1000–1016 (2012). https://doi.org/10.1016/j.neuroimage.2012.03.072
Metzler-Baddeley, C., O’Sullivan, M. J., Bells, S., Pasternak, O. & Jones, D. K. How and how not to correct for CSF-contamination in diffusion MRI. Neuroimage 59, 1394–1403 (2012). https://doi.org/10.1016/j.neuroimage.2011.08.043